RETURN TO ALCOHOL SOCIOLOGY HOME PAGE
How good are the conventional estimates? Stalking the origins of historical U.S. per capita alcohol consumption statistics
(revised)
Greg Austin and Ron Roizen
Revised version of a paper presented at the Alcohol & Temperance History Group's International Congress on the Social History of Alcohol, Huron college, London, Ontario, Canada, 13-15 May 1993. The research and writing of this paper were supported by National Institute on Alcohol Abuse and Alcoholism grant AA04570 to the Southwest Regional Laboratory.
How good are currently available historical time-series estimates of U.S. apparent per capita alcohol consumption? Not quite as good as one might have assumed, we argue below.
I
There are two conventional or standard sources for historical consumption time-series in the current literature: (1) the Alcohol Epidemiologic Data System's (AEDS) periodic, consumption- oriented reports (the most recent, Williams et al. [1992]) and (2) William J. Rorabaugh's (1979) well known monograph, The Alcoholic Republic (see also Rorabaugh's [1976a] journal article and dissertation [1976b] on historical consumption). Three additional sources bear mention. Before 1981, alcohol researchers commonly turned for historical time-series to one or another edition of a series of booklets offering a variety of alcohol-related statistics published by the Yale (later Rutgers) Center of Alcohol Studies (e.g., Keller and Efron [1959], Efron et al. [1972], Keller and Gurioli [1976], Hyman et al. [1980]) -- we'll refer to these collectively as the "Yale/Rutgers series." Many editions of the Census Bureau's annually published Statistical Abstract of the United States (StatAbs) also provide one or more historical time-series tables on alcohol consumption. Though different StatAbs editions cover somewhat different spans of years and in differing degrees of detail, two or three editions of StatAbs can be combined to generate a continuous time-series stretching back to 1840. Finally, the Census Bureau's Historical Statistics of the United States (1975) provides three historical tables (P 235, P 236, and P 236a) on alcohol production (see Blocker, 1993 for critical discussion of these). These five sources (AEDS, Rorabaugh, Yale/Rutgers, StatAbs, and Historical Statistics) by no means exhaust the supply of available historical time-series, but beyond these one moves into a field of less well-known and less often used sources.
There are interesting genealogical connections across these sources, some of which we will have occasion to examine more carefully below. AEDS's historical time-series, for example, was borrowed directly from the Yale/Rutgers series,1 as the Yale/Rutgers series was presented up to 1976.2 The Yale/Rutgers time-series, in turn, derived from Jellinek's (1947) classic paper on contemporary alcohol-related trends. Jellinek borrowed his time-series estimates from StatAbs, merely performing a simple calculation upon StatAbs figures in order to convert them from per capita total population to Drinking Age Population (DAP) quantities. Thus, Jellinek's 1947 paper provides the link that anchors the AEDS and the Yale/Rutgers
time-series in StatAbs data. Even Rorabaugh's time-series, for 1840 and afterward, were apparently framed by the StatAbs series, though less directly.It may also be noted that there are essentially three kinds of estimation sources and methods lodged in historical time-series of U.S. alcohol consumption: (1) tax-based estimates, (2) census-based estimates, and (3) residual estimates (i.e., where neither tax-based nor census-based estimates are available). The federal government reintroduced a tax on alcohol in 1862,3 and tax-based data provided the foundation for consumption estimates from 1862 to 1919 and 1934 and afterward -- a long sweep of time interrupted only by national prohibition's brief reign (1920-1933). StatAbs drew its estimates for 1870 and thereafter from tax sources. The StatAbs series also offers consumption estimates for years 1840, 1850, and 1860 -- these, based primarily on the U.S. census of manufacture and net imports (see StatAbs, 1887, Table No. 67, p. 141ff). For years preceding 1840 (and during national prohibition) time-series estimation must rely upon a thicket of problematic sources including personal diaries, temperance reports, travelers' accounts, tavern ledgers, contemporary official or semi-official estimates, newspaper accounts, scattered tax-related data, and fragmentary census data, etc. (see Rorabaugh, 1976a, 1976b, 1979). Until Rorabaugh braved to offer consumption estimates for years earlier than 1840, there was very little in the modern literature that hazarded even spot estimates or images of trends (see Tyrrell, 1979 and Clark, 1976 for useful discussions of consumption trends), let alone a full time-series.
The historical literature (Rorabaugh, 1979; Tyrrell, 1979; Blocker, 1989; Clark, 1976) is broadly in accord that Americans drank much more, per capita, before the mid-19th-century than after. In a sense, there are two historical Americas with respect to consumption levels -- the heavy drinking "alcoholic republic" made familiar in Rorabaugh's (1979) monograph and a more temperate nation commencing in the mid-19th century. These two Americas are divided by what Tyrrell called a great period of national "sobering up" from 1800 to 1860. Unfortunately, the divide between these two long consumption eras also broadly corresponds to a qualitative divide in consumption-estimation sources -- with residual sources characterizing in the pre-1840 period and census/tax sources characterizing 1840 and afterward. In other words, the big historical shift in consumption co-occurs with a big shift in consumption estimation methods. Thus, we must be careful not to mistake a shift that is based on methodological change for a shift that is based on real change in consumption.
II
Aside from Rorabaugh, himself (1976a:357), the literature has not drawn attention to disagreements between the StatAbs-based time-series and Rorabaugh's time-series. One reason may be that the year-grouping practices of the two series are quite different -- Rorabaugh offered estimates at regular, five-year intervals whereas the AEDS system provided them in an awkward series involving decade years (e.g., 1850, 1860), decade-long periods (e.g., 1871-1880), and half-decade-long periods (e.g.,
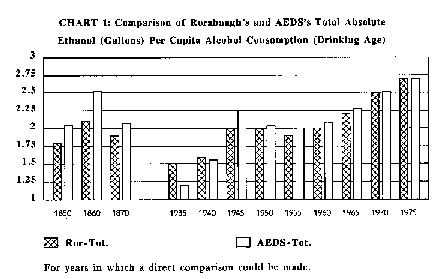
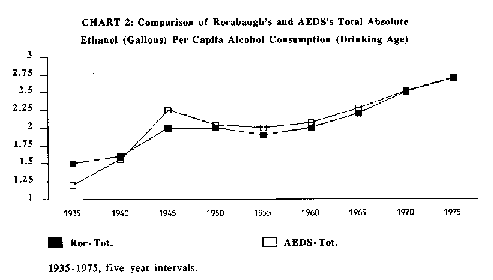
1896-1900). As a result, direct comparisons can be made for only a dozen year-points -- three in the 19th century (1850, 1860, and 1870) and nine in the 20th century (between 1935 and 1975, inclusive). CHART 1 [click on chart for larger image] illustrates the comparisons, using the AEDS series to represent the StatAbs-based group. It indicates substantial differences in AEDS's and Rorabaugh's total consumption estimates (pure ethanol, DAP) for 1850, 1860, 1935, and 1945 (see Table Al in Appendix I for detailed time-series, figures). The impact of these differences on the apparent trends in U.S. alcohol consumption are also noteworthy. CHARTS 2 and 3 plot trend lines across the 20th-century (CHART 2) and the 19th-century (CHART 3) estimation points that allowed for direct comparison. CHART 2 covers 1935 to 1975. It shows that the combination of AEDS's lower estimate for 1935 and higher estimate for 1945 combine to make AEDS's trend line indicate a sharp increase in consumption from 1935 to 1945; Rorabaugh's trend line, in contrast, suggests gradual change over the same period. After 1950 the two trend lines converge -- with Rorabaugh's line offering slightly lower estimates from 1950 to 1965.
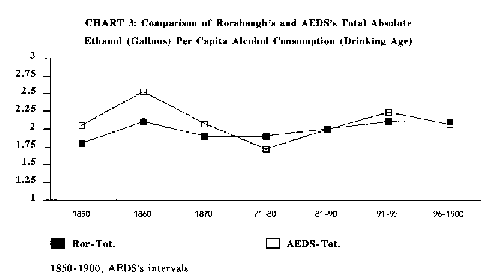
A similar difference in trend lines is suggested in the comparison of 19th-century estimates. Because Rorabaugh's time-series is the more temporally detailed of the two, Rorabaugh's time units can be collapsed into approximations of AEDS's time units. Thus collapsed, the two trend patterns can be compared more readily.4
CHART 3 clearly illustrates the differences in the two 19th-century trend lines. AEDS's line suggests a two-humped trend with consumption rising between 1850 and 1860, falling between 1860 and "1871-1880," rising thereafter until "1891-1895," and, finally, declining slightly by "1896-1900." Rorabaugh's trend line, on the other hand, suggests what Blocker (1989:64) called "the long plateau" in consumption over the second half of the nineteenth century. Hence, the analyst attempting to explain or to use U.S. consumption trends in the second half of the 19th century has quite different material to work with, and explanatory targets, depending on which time-series is employed.
III
As noted already, AEDS's historical time-series was borrowed directly from the Yale/Rutgers series of statistical booklets. That series' first edition appeared in 1952,5 the final edition appeared in 1980 (Hyman et al., 1980). How did the Yale/Rutgers series originate? According to a "Forward: Caveat" printed in a number of the booklet editions it initially derived from a handout Mark Keller used in connection with two statistically oriented lectures he delivered. Keller and Gurioli (1976) explain:
.At the Rutgers Summer School of Alcohol Studies, some sessions are usually devoted to "sizing up the magnitudes." The number of numbers that need to be tossed about is very big. If students attempted to copy many of them into their notebooks, the rate of accuracy would approach nullity. Besides, it interferes with hearing the discussion. We therefore adopted a policy of making the major arrays of numbers available in advance, as a packet of "statistical tables"; the sessions are then devoted to what these numbers might mean. The tables, thus, were not intended to stand alone as bits and masses of information, but to serve as bases for thinking and discussing. However, it has not been possible to keep them from circulating beyond the campus. They manage to get filed in collections, catalogued in libraries, and quoted in all sorts of "authoritative" documents. We have therefore yielded to circumstance and "published" these tables. To avert to some extent the possible harms from the crude use of such tabulations, we have added a few words of explanation, comment or caution to each table. These brief notes cannot take the place of the critical discussions at the Summer School, which open with the motto: To understand statistics about drinking, we must begin by thinking... Regrettably, we cannot here present the detailed slide demonstration which, at the Summer School, helps to illustrate the pitfalls and characteristic misuses of these compilations, and to reinforce our recognition that statistics can serve as the scholarly way to be wrong with confidence.Where did Keller, in turn, originally get his historical consumption statistics? The booklet's editions, historical tables cited a number of references (see, for example, Keller and Efron, 1959; Efron et al., 1972; Keller and Gurioli, 1976), but these appear to refer to the post-Repeal statistical estimates only. We are persuaded that the estimates for earlier years almost certainly derived from Jellinek's classic 1947 paper, "Recent Trends in Alcoholism and Alcohol Consumption." A number of considerations point to this conclusion.
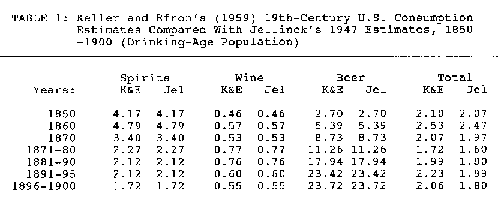
.Yale/Rutgers historical estimates are identical to Jellinek's (1947) estimates with regard to individual beverage groups--spirits, wine, and beer. TABLE 1 (below) compares Keller and Efron's (1959) figures with Jellinek's (1947). TABLE 1's figures for spirits, wine, and beer are expressed in beverage gallonages whereas the totals are expressed in pure ethanol gallonages. As the table shows, though all beverage volumes are identical, Jellinek's totals figures are consistently lower than Keller and Efron's. The totals figures differed because Jellinek (1947) and Keller and Efron (1959) used different estimates for the alcohol content of wine and beer in their totals calculations (both estimated spirits' alcohol content at 45%): Jellinek (1947) used 17% for wine and 4% for beer; Keller and Efron (1959) 18% and 5% respectively (though these alcohol percentages were actually described later--see Keller and Gurlioli, 1976, p. 5).
Of course, likeness -- even full identity -- does not imply that the Yale/Rutgers figures originated in Jellinek's (1947) figures. Both the Yale/Rutgers series and Jellinek's (1947) series may have stemmed from a third, common source. As it happens, a common-source explanation is unlikely in this case. This is so because Jellinek's 1850-1900 per capita consumption figures were newly-devised estimates based on a then-still-new estimation procedure that Jellinek was trying to popularize. The innovation in Jellinek's 1947 procedure was to argue that per capita alcohol consumption statistics should be averaged not over the country's entire population but averaged over the Drinking Age Population instead--i.e., the population old enough to be reasonably expected to be part, or potentially a part, of the actual fraction consuming alcohol. This DAP calculation method has since become a standard (though not universal) approach, but it was still new enough in 1947 for Jellinek to feel that he needed to make a sustained argument on behalf of its use (also see Jellinek, 1942, for an earlier round of his case for the DAP mode of calculation). Jellinek's figures in 1947, then, were newly calculated figures based on a still relatively new calculation approach using a drinking-age rather than a total-population denominator. The figures he generated had probably not appeared elsewhere before.
Where did Jellinek (1947) get his time-series estimates? Ironically, Jellinek's 1947 paper cites no specific source for the DAP consumption statistics it offered. His paper did, however, provide a table of detailed estimates of the proportions of the population aged 15-years-and-older (the DAP) in the census years from 1850 to 1940, inclusive. Those drinking-age-population proportions can now provide us with a crucial clue in determining Jellinek's source for his historical consumption estimates. By repeating Jellinek's likely transformation of total population consumption estimates into DAP consumption estimates, we can check for the origin of his statistics. The simplest form that transformation can take is to divide a total-population consumption estimate by the proportion of the population of Drinking-Age (15+). For example, if the total-population consumption estimate were, say, 12 gallons of beer per capita, and 75% of the population were aged 15 years or older, then the DAP transformation is simply 12/.75=16 gallons. In other words, if mean consumption is 12 gallons when the entire population is used in the calculation's denominator, then mean consumption will be 16 gallons when only persons aged 15+ are used in the denominator.
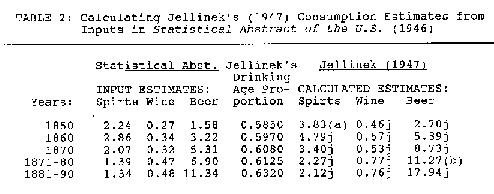
No doubt the likeliest candidate for the per capita total population consumption estimates Jellinek (1947) employed was the 1946 edition of StatAbs. In TABLE 2 we have carried out Jellinek's DAP transformation on data drawn from that year's StatAbs edition. We've confined our attentions to his estimates for the period 1850-1890, for reasons which will be explained in a moment. TABLE 2's left side reproduces the beverage-gallonage estimates reported in StatAbs (1946). The table's middle column (labeled "Age Proportion") provides the figure Jellinek probably used in carrying out the DAP transformation. We can be sure of the age-proportion figures Jellinek used his calculations for years 1850, 1860, and 1870 because these appear in TABLE 1 of his 1947 text (see Jellinek, 1947:2). However, the age-proportion figures for the grouped years, "1871-1880" and "1881-1890," are problematic -- Jellinek's census-based figures for proportion of the population 15 and older did not include estimates for these decade-long periods. Here, therefore, we derived new age-proportion estimates by averaging the age-proportion figures for 1870 and 1880 (to get an age-proportion figure for "1871-1880") and 1880 and 1890 (to get a figure for "1881-1890"). This seemed to us the likeliest procedure Jellinek would have followed in calculating age-proportion figures for the two decade-long periods. The StatAbs (1946) time-series also provided estimates for time periods "1891-1895" and "1896-1900." These, however, offered us no clear path in guessing how Jellinek's might have gone about assigning age-proportion figures, and therefore we dropped them from the table.
TABLE 2's right side reports the beverage-quantity figures derived from carrying out the DAP transformation. We have placed a "j" next to every calculated value that resulted in a figure identical with Jellinek's (1947) table. As TABLE 2 shows, of the 15 values calculated, 13 scored "direct hits." The two "misses" are marked (a) and (b). Miss (b) -- beer consumption in "1871-1880" -- missed by only one-hundredth of a gallon; Jellinek's figure was 11.26 gallons instead of the 11.27 figure reported in our table. Miss (b), therefore, may have resulted from a rounding error. However, miss (a) -- spirits consumption in 1850 -- involves a more substantial difference. Jellinek's table's figure was 4.17 gallons, or 0.34 gallons greater than our calculated figure of 3.83 gallons. We do not know the origins of this Jellinek figure. Whatever the reasons for this deviant case, however, TABLE 2's overall pattern of "direct hits" at two-decimal-places accuracy suggests that Jellinek did indeed perform his DAP transformation on StatAbs estimates or on estimates derived therefrom. (Oddly enough, two "misses" also tend to vouchsafe that the Yale/Rutgers series was indeed drawn from Jellinek's [1947) figures in that the identity between the two sets of figures, Yale/Rutgers' and Jellinek's, suggests that even the two deviant values were copied from Jellinek's figures.)
What have we shown so far about the AEDS historical time-series? We've shown that AEDS's 19th-century figures derive from Yale/Rutgers, that Yale/Rutgers' figures derive from Jellinek (1947), and that Jellinek's (1947) figures are the result of a Drinking Age Population transformation on figures available in StatAbs (1946). It follows that AEDS's 19th-century time-series estimates are prone to the pitfalls, biases, and limitations that the 19th-century StatAbs series harbor--some of which we will examine in a moment, after a very brief consideration of Rorabaugh's mid-19th-century estimates.
IV
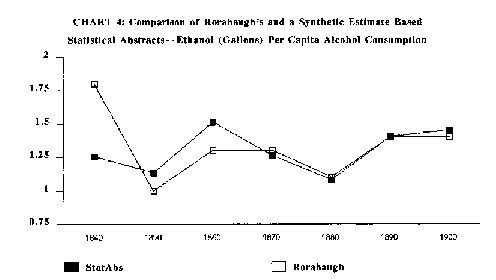
Ironically, Rorabaugh was well aware that his mid-19th-century estimates differed from the StatAbs, the Yale/Rutgers (Efron et al., 1972), and even the earlier Jellinek (1947) time-series. As CHART 4 illustrates, Rorabaugh's estimate for 1840 was considerably higher than the StatAbs estimate, his estimates for 1850 and 1860 were lower, and his estimates for the rest of the century were in closer accord. Why these divergences in the 1840, 1850, and 1860 estimates?
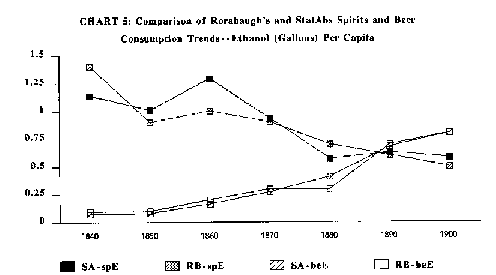
Rorabaugh held that the 1840 census was characterized by underestimation (Rorabaugh, 1976a:357) and that census-based estimates for 1850 and 1860, on the other hand, failed to take into account the fraction of spirits production that was diverted into use as "an important fuel, industrial solvent, and lighting fluid" (loc. cit.). "In 1860," Rorabaugh argues, "as much as one-third of the distilled spirits was not drunk" (loc. cit.). CHART 5 compares Rorabaugh's ("RB-spE") and StatAbs' ("ST-spE") trend lines for distilled spirits consumption and Rorabaugh's ("RB-beE") and StatAbs' ("ST-beE") trend lines for beer consumption. It confirms that differences between Rorabaugh's and the StatAbs, trend lines for total ethanol consumption in the mid-19th-century derive primarily from differences in each's trend lines for distilled spirits consumption. (Wine contributed only negligibly to contemporary overall consumption estimates, and can be disregarded in this comparison.)
Another factor may be said to enter into the explanation of the discrepancy between Rorabaugh's and StatAbs' mid-19th-century trend lines. Rorabaugh used "three-point moving averages" to smooth his consumption estimates (Rorabaugh, 1979:229). Such an approach doubtless dragged his 1840 estimate upward because 1835's consumption level was much greater than 1840's, whereas 1840's estimate was closer to 1845's. In a three-point moving average calculation, neighboring values differ greatly exert a greater influence than neighboring values that are close to the same value. The short period from 1830 to 1840 saw Rorabaugh's consumption estimates fall very sharply indeed -- in the steepest segment of the great decline that divided the two Americas. Consumption fell by more than 50% of its 1830 level by 1840 (from 3.9 to 1.8 gallons, pure ethanol, per capita or from 7.1 to 3.1 gallons, pure ethanol, DAP).
Rorabaugh's mid-19th-century estimates may be said to reflect the impact of three factors: (1) the underestimation characteristic of the census tabulations of alcohol production (particularly with respect to the 1840 estimate), (2) the over-estimation occasioned by failing to reduce apparent consumption estimates by the portion of spirits being diverted to nonbeverage uses (in 1850 and, particularly, in 1860), and, finally (3) the substantive consequence of a three-point moving average methodology in a period characterized by steep decline on one temporal side and less steep decline on the other. The net impact of these influences can be gauged in the divergent courses Rorabaugh's and the StatAbs take over the 1840-1860 period: Rorabaugh's total ethanol consumption estimate for 1840 is 44% higher than StatAbs' (1.80 versus 1.25 gallons ethanol per capita) whereas his estimates for 1850 and 1860 are 13% and 16% lower than StatAbs', respectively (1850: 1.00 vs. 1.13 gallons; 1860: 1.30 vs. 1.51 gallons).
V
A number of significant weaknesses may be said to reside in the StatAbs alcohol time-series over this 50-year period. Rorabaugh spotted an important one--namely, production estimates, particularly in 1860, did indeed fail to reflect the significant fraction of distilled spirits being diverted into nonbeverage use (see Hu, 1950). Blocker (1993) has recently suggested another important bias -- namely, conventional per capita consumption estimates (including StatAbs) fail to increase the the denominator by known shortfalls in the popular enumerations carried out by 19th-century censuses. Together, these two factors may significantly reduce apparent consumption estimates for the mid-19th-century. Blocker (1993:10-11) suggested, for example, that the census of 1860 under-enumerated the national population by about 16%--a calculation that reduces apparent per capita alcohol consumption by roughly an equivalent percentage. Rorabaugh (1976a:357) suggested that spirits consumption estimates in 1860 should be reduced by a factor reflecting that "up to one-third" of production was not drunk. Together, the two reductions would result in roughly a 44% reduction in estimated spirits consumption for 1860, and -- in light of the dominance of spirits over beer consumption at the time -- roughly a 40% reduction in estimated total ethanol consumption.
Yet, Rorabaugh's and Blocker's inclinations to reduce apparent consumption in 1860 must be measured against very considerable contemporary sources of under-estimation. Underestimation came in three forms: (a) census undercounting of commercial manufacture, (b) noncounting of small commercial and semi-commercial stills, and (c) noncounting of home production. Undercounting of commercial manufacturing could result from missing a distillery or brewery entirely or underestimating its annual production. Both sorts of underestimation were probably substantial.
The census estimation procedure was itself prone to great underestimation of alcohol production. Enumerators were instructed to estimate and register production only when annual production was valued at $500 or greater (Wright & Hunt, 1900) -- a dollar amount which was equivalent to a great deal of beverage spirits in 1850 and 1860, particularly in states where prices were very low. According to census figures for 1860 the national mean price of spirits was then roughly 28 cents a gallon, and more than half the country's population lived in locales where the price was 30 cents or lower. Even at 50 cents a gallon, a producer could produce up to 1,000 gallons in a year without technically being obliged to report the still at all. At 20 cents a gallon, producers could run up to 2,500 gallons without being required to report. Census figures for 1860, moreover, reveal that commercial production output in the 1,000-2,000 gallons range was not uncommon (U.S. Census, 1862:123). Indeed, in several states -- North Carolina, Georgia, South Carolina, Texas, Kansas, and New Mexico Territory -- mean output per enumerated still fell roughly within this range (loc. cit.). Thus a considerable fraction of commercial production in 1860 fell below the minimum criterion for reporting to the census.
Production whose output was intended for home or plantation use, moreover, would have no commercial price associated with it, so long as the product was not sold for over $500; and therefore census enumerators were not obliged to count and report it. The year 1860 represents a kind of watershed year both with respect to the urbanization of the population and the balance between home production and industrial manufacture. It was a last hurrah for the rural, home-producing, non-money system that stretched back to the country's founding. The country's vast geography and its highly dispersed rural population argue for both the popularity of home production and the difficulty of covering the nation's alcohol production via the census mechanism.
Illicitness also provided a source of undercounting in the 1860 census. A state-prohibition craze, beginning with the Maine law, swept the country in the early 1850s. The craze, however, was soon followed by a "wet backlash" and popular repeal movements by the late 1850s, with few states remaining entirely dry by 1860. Recently, or still-dry states, such as Vermont, New Hampshire, and Rhode Island were recorded by the 1860 census as having no distilling establishments at all and therefore no production of spirits; yet these no doubt harbored their shares of illicit stills. Similar circumstances occurred in legally dry towns and counties. As Tyrrell noted (1979:318), local option in some cases took over where state prohibition had failed to endure. But the distinction between dry and wet locales in 1860 is hazy in practice. Popular sentiment in 1860 was unlikely to underwrite prohibition, thus no doubt giving rise to widespread commerce in alcohol and official winking at infractions. In 1860, moreover, so recent a wave of temperance sentiment no doubt also counseled prudent commercial producers to minimize rather than enhance the volume of annual production in their reports to the census.
Though the matter cannot be settled with certainty, we suspect that aggregate sources of underestimation more than off-set the impacts of both contemporary population undercounts and spirits production for nonbeverage purposes. If so, then StatAbs estimates must be relatively increased -- rather than decreased -- to reflect true U.S. consumption levels. StatAbs' alcohol-related estimates represent only one of a great mountain of statistics processed annually by the U.S. Bureau of the Census. Census analysts and clerks do not make long and patient studies of biases in alcohol consumption measures and reports. StatAbs statistics, moreover, are drawn from official statistics -- census and tax data -- that make no provision whatever for either under- or over-reporting biases in official data collection methods. A good example of this limitation occurs in the decade of the 1870s, when "The Great Whiskey Ring Fraud," a massive skimming enterprise, that significantly distorted U.S. alcohol-based tax revenues (see Guese, 1942; Carson, 1963; Mittelman, 1986). Nevertheless, StatAbs estimates in the early 1870s dutifully reported the actual apparent alcohol consumption data, making no adjustment for the substantial underestimation they harbored. Those same StatAbs estimates, in turn, became the basis for AEDS's and even Rorabaugh's 1870s figures.
The literature's reliance on both AEDS's and Rorabaugh's time-series tells a tale of benign indifference that is probably not entirely unusual in the history of official statistics. Both sources' historical consumption tables commenced as adjuncts or sidelights in larger endeavors -- AEDS's table, as a handout in Ke1ler's Summer School course and Rorabaugh's table, as an adjunct to his history of heavy drinking patterns in the country's Early Republic period. Surely neither author ever intended his time-series to become the standard reference; both warned that their numbers would not bear the weight of exacting statistical use. Yet both time-series drifted into common use and acquired no little authority by-and-by.
FOOTNOTES:
1 A typographical error (Williams, 1993), however, seems to have occurred in the borrowing. Yale/Rutger's estimate for wine consumption in 1850, 0.8 gallons (pure ethanol, Drinking Age Population), was mistakenly rendered as 0.3 gallons in the first AEDS historical table. The mistake was reflected as well in the two time-series' total ethanol estimates for 1850: Yale/Rutgers' figure was 2.10 gallons whereas AEDS's figure was 2.05 gallons -- i.e., the same five-hundredths of a gallon lower. AEDS's initial "typo" has been carried forward and republished in subsequent AEDS historical tables.
2 The first AEDS historical table was published in 1981 (AEDS, 1981) and drew its historical time-series from the 1976 (Keller and Gurioli, 1976) rather than the final, or 1980 (Hyman et al., 1980), edition of the Yale/Rutgers booklet series. Hymen et al. (1980) incorporated Rorabaugh's pre-1850 estimates running back six earlier decade years (1790, 1800, 1810, 1820, 1830, and 1840) into its historical table but did not adjust 1850-and-afterward in light of Rorabaugh's divergent estimates. Hence, the 1980 edition of the Rutgers series is a hybrid combining a half-dozen of Rorabaugh's pre-1850 estimates with the Yale/Rutgers estimates for 1850 and afterward. The 1976 edition did not incorporate Rorabaugh's figures. AEDS estimates, therefore, did not initially present estimates for years earlier than 1850, and subsequent AEDS publications of the historical time-series table have not changed that practice.
3 Federal alcohol taxation, as Rorabaugh noted, had also been attempted in preceding and "haphazardly enforced" (Rorabaugh, 1976a:357) efforts in 1791-1801 and 1814-1817.
4 This approach has the disadvantage of tending to further smooth Rorabaugh's estimates. However, Rorabaugh's raw estimates for 1850-1900 are sufficiently flat that our method does no great violence to the trend lines his original estimates described. Our collapsing method was as follows: (1) for a Rorabaugh equivalent to AEDS's "1871-1880" entry, we took the mean of Rorabaugh's estimates for 1870, 1875, and 1880; for the Rorabaugh equivalent to AEDS's "1881-1890" entry, we took the mean of Rorabaugh's 1880, 1885, and 1890 estimates; for a Rorabaugh equivalent to AEDS's "1891-1895" entry, we took the mean of Rorabaugh's 1890 and 1895 estimates; and, finally, for a Rorabaugh equivalent to AEDS's "1896-1900" entry, we took the mean Rorabaugh's 1895 and 1900. This approach is inexact, to be sure, but it affords a broad picture of the differences in the two time-series' trend lines (see CHART 3).
5 Rutgers librarian, Penny Page, informs us that the booklet's first published edition appeared in this year.
REFERENCES:
Blocker, Jack S. Jr., "Consumption and Availability of Alcoholic Beverages in the United States, 1863-1920: New Estimates and Hypotheses," typescript draft, received September 1992 (cited with permission) and published as Blocker, J.S., Jr., "Consumption and availability of alcoholic beverages in the United States, 1863-1920," Contemporary Drug Problems 21:631-666, 1994.
Blocker, Jack S. Jr., American Temperance Movements: Cycles of Reform, Boston: Twayne Publishers, 1989.
Carson, Gerald, The Social History of Bourbon, New York: Dodd, Mead & Co., 1963.
Clark, Norman, Deliver Us From Evil: An Interpretation of American Prohibition, New York: W.W. Norton & Co., 1976.
Efron, V., Keller, M., and Gurioli, C., Statistics on Consumption of Alcohol and on Alcoholism, New Brunswick, NJ: Rutgers Center of Alcohol Studies, 1972.
Guese, Lucius E., "St. Louis and the Great Whiskey Ring," Missouri Historical Review 36:160-183, 1942.
Hu, Tun Yuan, The Liquor Tax in the United States, 1791-1947, New York: Columbia University Press, 1950.
Hyman, M.M., Zimmerman, M.A., Gurioli, C., and Helrich, A., Drinkers, Drinking and Alcohol-Related Mortality and Hospitalizations, New Brunswick, NJ: Rutgers Center of Alcohol Studies, 1980.
Jellinek, E.M., "The Interpretation of Alcohol consumption Rates with Special Reference to Statistics of Wartime Consumption," Quarterly Journal of Studies on Alcohol 3:267-280, 1942.
Jellinek, E.M., "Recent Trends in Alcoholism and in Alcohol Consumption," Quarterly Journal of Studies on Alcohol 8:1-42, 1947.
Keller, Mark, and Efron, Vera, Selected Statistics on Alcoholic Beverages and on Alcoholism, New Haven, CT: Journal of Studies on Alcohol, 1959.
Keller, Mark, and Gurioli, C., Statistics on Consumption of Alcohol and on Alcoholism, New Brunswick, NJ: Journal of Studies on Alcohol, 1976.
Mittelman, Amy, The Politics of Alcohol Production: The Liquor Industry and the Federal Government, 1862-1900, Ph.D. dissertation, Columbia, 1986.
Rorabaugh, W.J., "Estimated U.S. Alcoholic Beverage Consumption, 1790-1860," Journal of Studies on Alcohol 37:357-363, 1976a.
Rorabaugh, W.J., The Alcoholic Republic: America, 1790-1840, Ph.D. dissertation, history, University of California, Berkeley, 1976b.
Rorabaugh, W.J., The Alcoholic Republic: An American Tradition, New York, Oxford: Oxford University Press, 1979.
Tyrrell, Ian R., Sobering Up: From Temperance to Prohibition in Antebellum America, 1800-1860, Westport, CT: Greenwood Press, 1979.
Williams, Gerald D., Personal Communication, April 1993.
Williams, G.D., Stinson, F.S., Clem, D., and Noble, J., Surveillance Report #23: Apparent Per Capita Consumption: National, State, and Regional Trends, 1977-1990, NIAAA/AEDS, Washington, D.C.: CSR Inc., 1992.
Wright, Carroll, and Hunt, William C., History and Growth of the U.S. Census, Washington, D.C.: U.S. Government Printing Office, 1900.
U.S. Bureau of the Census, Historical Statistics of the United States, Colonial Times to 1970, Vol. 1, Washington, D.C.: U.S.G.P.O., 1975.
U.S. Bureau of the Census, Statistical Abstract of the United States, Washington, D.C.: U.S.G.P.O., 1887.
U.S. Bureau of the Census, Statistical Abstract of the United States, Washington, D.C.: U.S.G.P.O., 1946.
